1 June 2015
Commodity Pricing Graphs
The last 6 weeks have seen some fluctuations in Gold and Nickel,
but both finishing off near where they started at the beginning of
the 6 weeks. Iron Ore has had a slight increase while Coal has
steadily declined during the last 6 weeks.
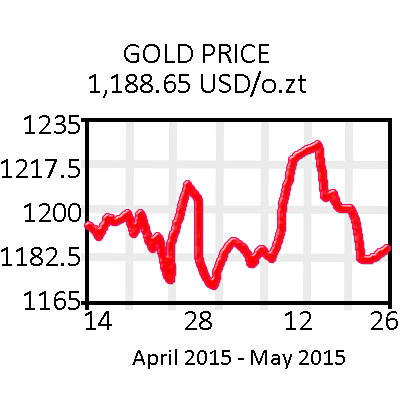
Gold has been through a bumpy ride
over the past 6 weeks, starting mid April around $1,200 USD/OZT and
peaking in Mind may to above $1,220 US/OZT, finishing May off just
above $1,185 USD/OZT.
|
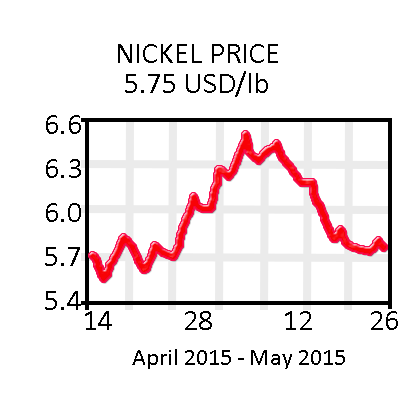
Nickel started mid April just below
$5.7 USD/lb and ended the end of May just above $5.7 USD/lb. It did
peak at the beginning of May at $6.5 USD/lb.
|
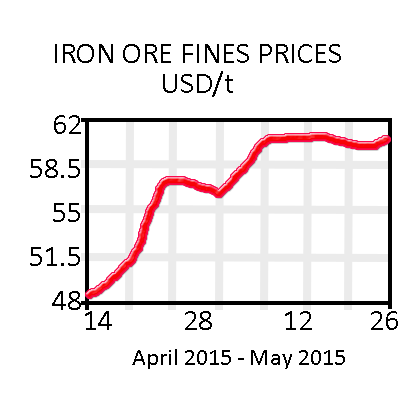
Iron Ore Fines has experienced a
small increase, over the past 6 weeks, starting out below $50 USD/t
mid April, it has finished May off just above $60 USD/t.
|
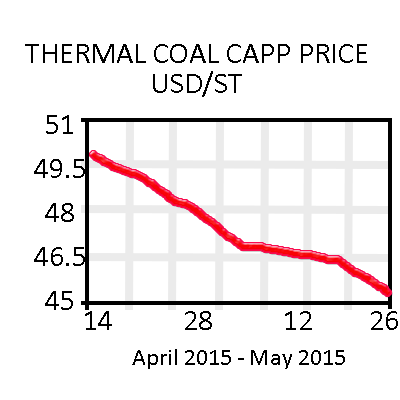
Coal continued to decline throughout
April and May, starting just over $50 USD/ST mid April, it finished
May off below $45 USD/ST.
|