2 March 2015
Commodity Pricing Graphs
Following popular demand, we're now including a commodity wrap
up for the the weeks between our newsletters. This first one looks
back 6 months to September 2014.
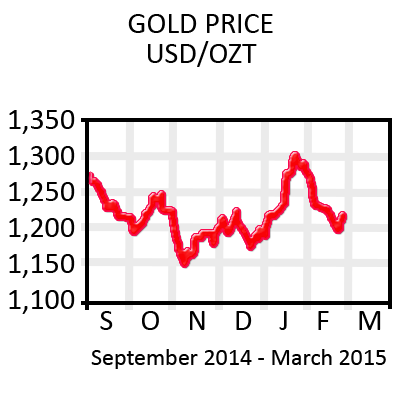
Gold dropped to $1,150 USD/OZT in
November, experienced a high of $1,300 USD/OZT in January
and is now on the rise again after falling to
$1,200 USD/OZT in February.
|
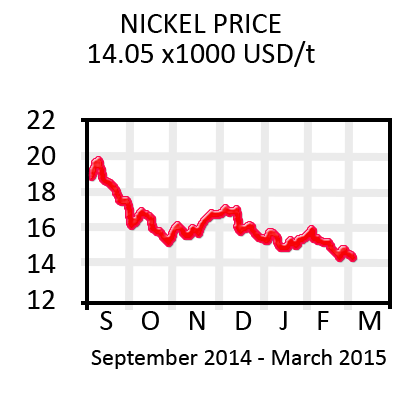
Nickel was at it's highest in
September at
$20,000 USD/t and is still on a downward trend,
starting March on $14, 000 USD/t.
|
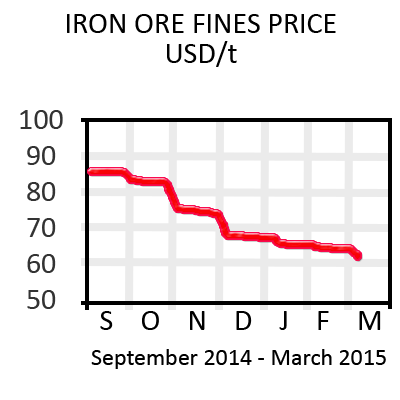
Iron Ore Fines started out at $87.69
USD/t in September and have been declining month by
month since, at the beginning of March it was $62.57 USD/t
and as we send out our newsletter it's hit a 9 year low of $58.20
USD/t on the 6th of March.
|
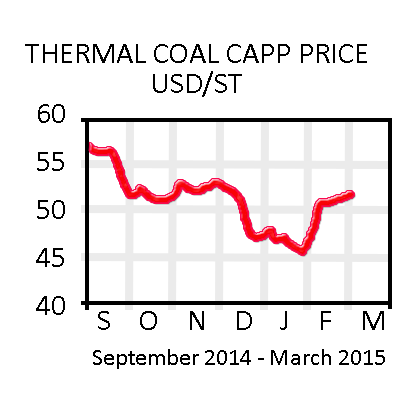
Coal was at it's highest in
September just of $55USD/ST, hit a low of $45USD/ST in January and
is now on the rise again at just over $50USD/ST.
|