5 September 2016
Commodity Pricing Graphs
Let's take a look at what's been happening with commodity
pricing since March 2016!

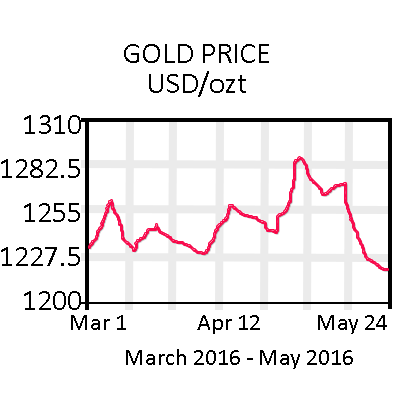
Gold started March and finished May
on much the same, spiking several times during the period it topped
the chart at just over 1282.50 at the end of April / early May.
|

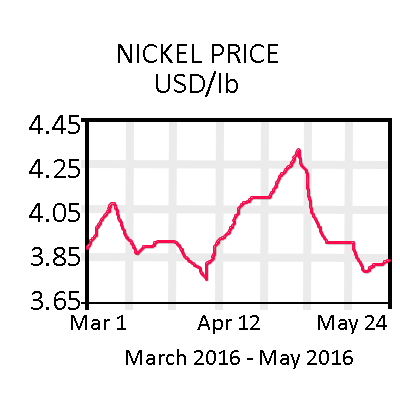
Nickel also started March and
finished May on much the same, spiking several times during the
period it topped the chart at just over 4.25 at the end of April /
early May.
|

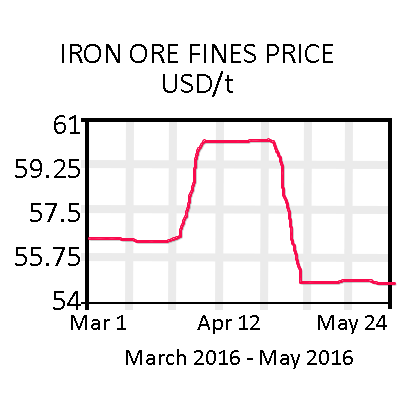
Iron Ore Fines went through periods
of stability during the period of March - May, climbing to and
maintining just over 60 during most of April, ending on 54.75 at
the end of May
|

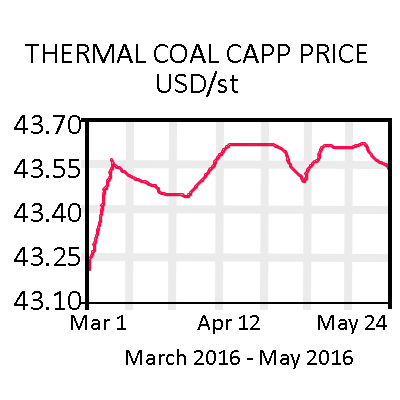
Coal experienced a growth over the
period of March to May, staring at 43.25 on March 1 and ending on
43.55 on the 31st of May.
|